
With all the talk of Microsoft Teams going around I thought there would be no space for a Skype for Business blog post on the internet any more, but it turns out I was wrong and I’ve managed to shoe horn this one in.
Today I had to look into an issue where someone who was trying to retrieve logs from the Skype for Business CLS logging service using the “Skype for Business 2015, Logging Tool” was generating an empty log file.
The servers them selves were configured with the AlwaysOn scenario enabled and should have been constantly creating cached ETL files for searching, but it wasn’t.
Logging onto one of the Front-End servers in the problematic enterprise edition pool the first thing I did was double check the AlwaysOn scenario was running, which it was, then I double checked the CLS logging configurations with:
Get-csclsconfiguration
The result was as expected and no issues visible there.
Next, I jumped into the event log viewer and opened the “Lync Server” event log and filtered the log on Event source “LS Centralized Logging Agent”. Almost immediately in front of me I spotted an Error event log entry with Event ID 33022.
Log Name:      Lync Server
Source:        LS Centralized Logging Agent
Date:          1/08/2019 12:22:35 PM
Event ID:      33022
Task Category: (1007)
Level:         Error
Keywords:      Classic
 User:          N/A
 Computer:      MyFE01.muzza.tech.blog
 Description:
 Centralized Logging Service Agent The component tracing rate exceeded the 'ComponentThrottleLimit' more than 'ComponentThrottleSample' number of times.

 Component: SIPStack, new Level TL_WARN
 Cause: Centralized Logging Service Agent The component emits trace records at a rate that exceeded the 'ComponentThrottleLimit' defined in CMS, and it happened more than 'ComponentThrottleSample' number of times. To prevent machine overload, the CLS Agent is lowering the logging level.
 Resolution:
 Fix the component so that it will log less data at default level. Or, to re-enable tracing at the default level, restart the scenario.
So I did as the event log suggested, I restarted the AlwaysOn scenario. But just prior to that I setup a Performance Monitor data collector set to monitor “ClsAgent – per second rate of trace records”.
With this running I new that should the CLS Agent be emitting excessive trace records as the Event Log suggested I’d capture when it was happening in PerfMon.
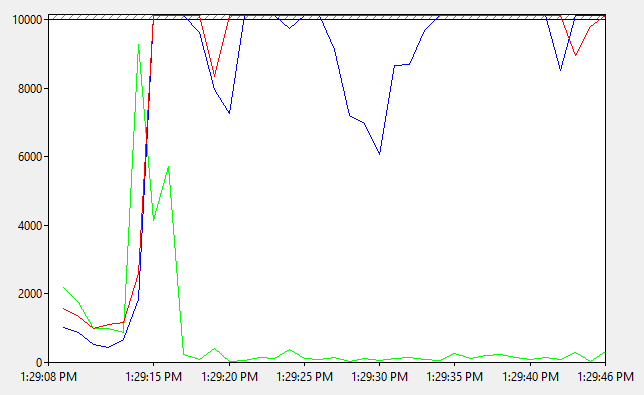
And within no time at all it did happen again, all too soon. So I opened up PerfMon and I immediately noted a number of spikes reaching well over the threshold limits that in my configuration were set to 5000 and I knew exactly what time to concentrate on when looking for more clues.
Back to the event log I went, this time concentrating on the time of the first spike and here I found a series of warnings and event log entries that indicate a problem all started from this:
 Log Name:      Lync Server
 Source:        LS Protocol Stack
 Date:          2/08/2019 1:29:13 PM
 Event ID:      14397
 Task Category: (1001)
 Level:         Warning
 Keywords:      Classic
 User:          N/A
 Computer:       MyFE01.muzza.tech.blog
 Description:
 A configured certificate could not be loaded from store. The serial number is attached for reference.

 Extended Error Code: 0x80092004.
So with this error in hand I made for the certificate store on the server and here (as well as on the other front ends in my pool) I found a certificate store full of old certificates. The one the error above was complaining about was no longer assigned to any SfB services so I removed it and all the other old unassigned certificates.
Since then I haven’t seen the problem occur again. I have seen many other problems occur in the past due to a badly maintained certificate store, so the moral of the story: Keep your certificate stores clean and well organised.
